A recent expansion of a manufacturing facility near the Ambassador Bridge ran into unexpected saturated clays at just four meters depth. The initial boreholes missed the lateral extent of the problem. Our crew deployed a Vertical Electrical Sounding array across the site and within a single day mapped a continuous low-resistivity zone stretching sixty meters, tracing an old infilled drainage channel that conventional drilling alone could not resolve. Windsor's stratigraphy tells a complicated story: glacial lake deposits, soft Detroit River Group clays, and shallow limestone bedrock all coexist within a few city blocks. Combining test pit investigations with surface resistivity profiling gives engineers the three-dimensional picture they need before committing to deep foundations or excavation support.
Mapping Windsor's buried clay channels and bedrock relief with resistivity surveys reduces foundation risk before the first excavator arrives on site.
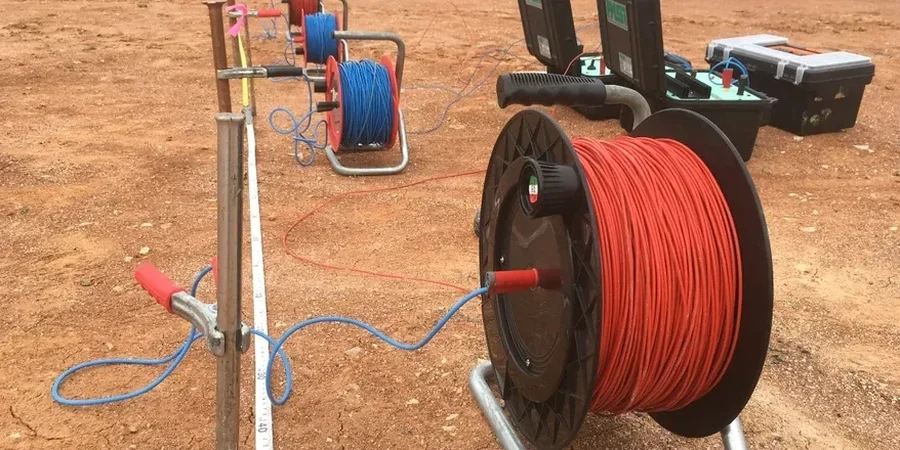
Our approach and scope
The field setup used for Windsor projects typically employs a Syscal Pro resistivity meter with a multi-electrode cable system. For a standard VES sounding, four electrodes are placed in a Schlumberger array, expanding the current electrode spacing progressively from 1.5 meters out to 150 meters or more depending on target depth. In the tight easterly neighborhoods of Riverside or Walkerville, the crew often has to thread cable paths between century-old homes, so the compact ABEM Terrameter with a 48-electrode switch box becomes the practical choice. Each measurement cycle injects a controlled DC current and records the potential difference, producing apparent resistivity values that are then inverted using RES2DINV software. The resulting cross-section differentiates clay-rich units at 5-15 ohm-m from clean sand and gravel at 50-200 ohm-m, and clearly identifies the top of the limestone bedrock, which typically shows values above 300 ohm-m in the Amherstburg Formation underlying the city.
Frequently asked questions
What is the typical cost of a VES resistivity survey in Windsor?
For a standard VES sounding with interpretation, budgets in the Windsor area generally fall between CA$960 and CA$1,560 per sounding point, depending on maximum electrode spread and site accessibility. A full 2D ERT profile along a 200-meter line typically starts around CA$2,400 and scales with electrode density.
How deep can resistivity surveys see in the Windsor clay belt?
With the Schlumberger array, useful penetration reaches roughly one-quarter to one-third of the maximum current electrode separation. On Windsor sites we routinely achieve 60 to 80 meters of investigation depth, which is sufficient to resolve the contact between glacial drift and the underlying Amherstburg or Lucas Formation limestone across most of the city.
Can resistivity distinguish between clean sand and clay in Windsor's glacial deposits?
Yes, and this is one of the method's strongest applications here. The saturated clays of the Detroit River Group and glaciolacustrine deposits typically register between 5 and 15 ohm-m, while water-bearing sand and gravel units range from 40 to over 200 ohm-m. The contrast is sharp enough that we can map sand channels and buried eskers within the clay matrix with good lateral resolution.