We were called out to a site off Walker Road last spring where the owner kept hitting old foundry fill at three meters depth—random pockets of slag and brick that made standard drilling a guessing game. The solution came from walking a 115-meter geophone spread across the lot and stacking sledgehammer shots every two meters. In half a day we had a P-wave velocity tomogram showing exactly where the natural clay started, and the contractor adjusted his excavation plan before lunch. That kind of speed is what makes seismic refraction and reflection methods practical for Windsor projects, where the overburden above the Detroit River Group limestone can shift from four to fourteen meters across a single city block. The technique works by measuring how seismic energy travels through the subsurface—faster through competent rock, slower through loose fill or weathered shale—and turning those travel times into a layered velocity model. For engineers dealing with the glacial lake plain deposits that cover most of Essex County, this gives a continuous image between boreholes rather than just point data. We run the survey, process the first arrivals with tomographic inversion software, and deliver a depth-to-bedrock map or rippability assessment keyed to Ontario Building Code requirements. Whether you are placing deep foundations near the river or checking for abandoned infrastructure under a redevelopment site, the method cuts through the guesswork that comes with Windsor's industrial legacy soils.
A seismic velocity tomogram gives you what twenty boreholes cannot—a continuous image of the subsurface that catches the anomalies between the drill points.
Our approach and scope
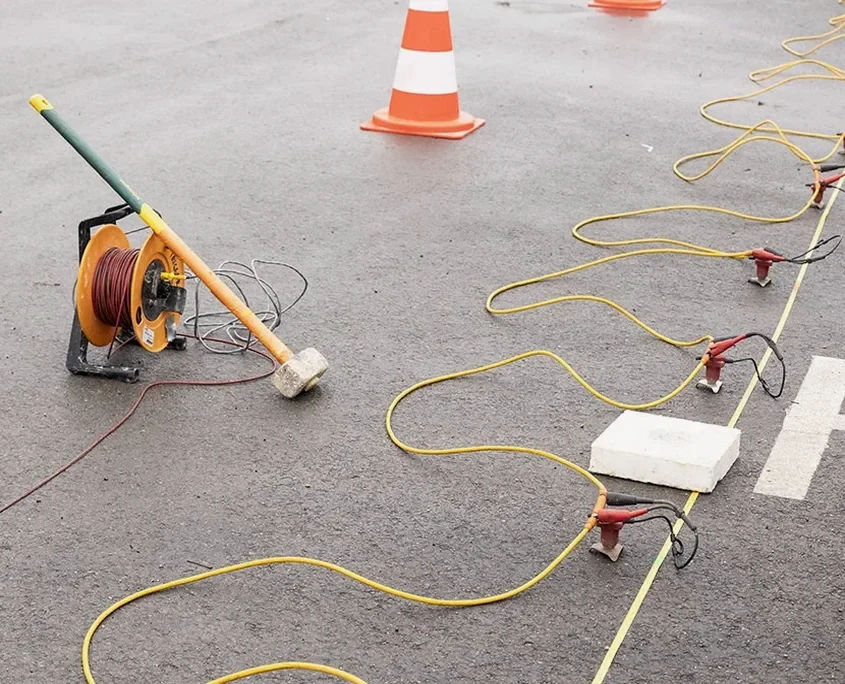
The field setup we bring to a Windsor job starts with a 24-channel seismograph connected to a spread of 4.5 Hz or 14 Hz vertical geophones, spaced anywhere from one to five meters depending on the target depth. For shallow refraction work—say, mapping the top of bedrock under a proposed warehouse slab—we use a sledgehammer and aluminum strike plate as the source, which gives reliable first breaks down to about 15 meters in the local clay till. When we need deeper penetration or reflection data across the Detroit River Group interfaces, we switch to a weight drop or an accelerated weight drop system that can stack energy over multiple hits. Everything runs on battery power and the whole spread can be laid out by a two-person crew in under an hour, which matters when you are working next to active assembly lines or busy commercial lots. Processing happens the same evening: we pick first arrivals, build an initial velocity model, and run a tomographic inversion that iterates until the misfit between calculated and observed travel times drops below a set threshold. The result is a color-contoured cross-section that a geotechnical engineer can read almost intuitively—blue for loose fill, green for stiff clay, red for bedrock. We cross-check the seismic velocities against any available borehole or
CPT test data to anchor the interpretation, and when the project calls for shear-wave velocity profiles, we run a separate MASW line alongside the refraction spread. For deeper infrastructure planning, the reflection method uses a common midpoint geometry that stacks signals to image stratigraphy down to 100 meters or more, useful when assessing the Salina Group evaporites that underlie parts of the region.
Frequently asked questions
How much does a seismic refraction survey cost for a typical lot in Windsor?
For a standard residential or small commercial lot in Windsor, a seismic refraction survey with one or two 115-meter lines typically runs between CA$3,640 and CA$6,960 depending on the number of shots, line length, and whether we bring a weight drop source for deeper penetration. We provide a fixed quote after reviewing your site plan and target depth requirements.
Can you run a seismic survey on a paved parking lot or inside an active factory?
Yes, we regularly work on pavement and indoors. For asphalt or concrete surfaces we bolt the geophones directly to the ground with small anchors or use base plates that couple without drilling. Inside operational facilities we coordinate with plant managers to work around shift schedules and use hammer sources that produce minimal disruption—no explosives required.
How long does the fieldwork take and when do I get the report?
A typical single-line refraction survey on a Windsor lot takes two to four hours of field time, including setup and breakdown. We process the data the same day and deliver an interpreted cross-section with velocity contours within three business days. Larger multi-line or reflection projects may take a week for the full report package.
What is the difference between seismic refraction and a MASW survey?
Refraction uses P-waves to map layer boundaries and bedrock depth based on compressional velocity contrasts. MASW measures surface waves to build a shear-wave velocity profile down to about 30 meters, which is what you need for seismic site class determination per NBCC. We often run both lines on the same spread—the geophone layout is compatible—so you get P-wave stratigraphy and S-wave site classification from one mobilization.
Does the Detroit River affect seismic data quality on waterfront sites?
Sites near the Detroit River can present challenges from saturated soils and industrial vibration, but they are manageable with the right acquisition parameters. Saturated clay actually improves P-wave transmission, giving cleaner first arrivals. The bigger factor is cultural noise from marine traffic or nearby machinery—we address it by stacking more blows per shot point and scheduling surveys during quieter periods when possible.